Sampols Overview
Sampols is a high-performance, low-cost solution for acoustic noise cadaster management, based on the Internet of Things paradigm.
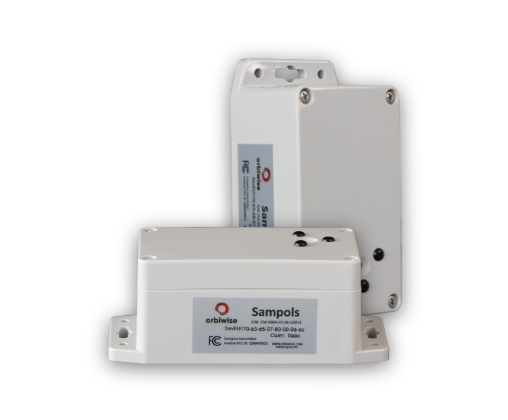
Sampols’ sensor is a light, autonomous and high performance outdoor wireless sensor that continuously measures, computes and reports the statistics of ambient noise.
Sampols NoiseApp is a practical and scientific tool designed to easily manage measurement, analytics and visualization of noise pollution in cities or in industrial sites.
Getting Started with Sampols
The following section will help you get your Sampols’ device configured and help you start using Sampols NoiseApp.
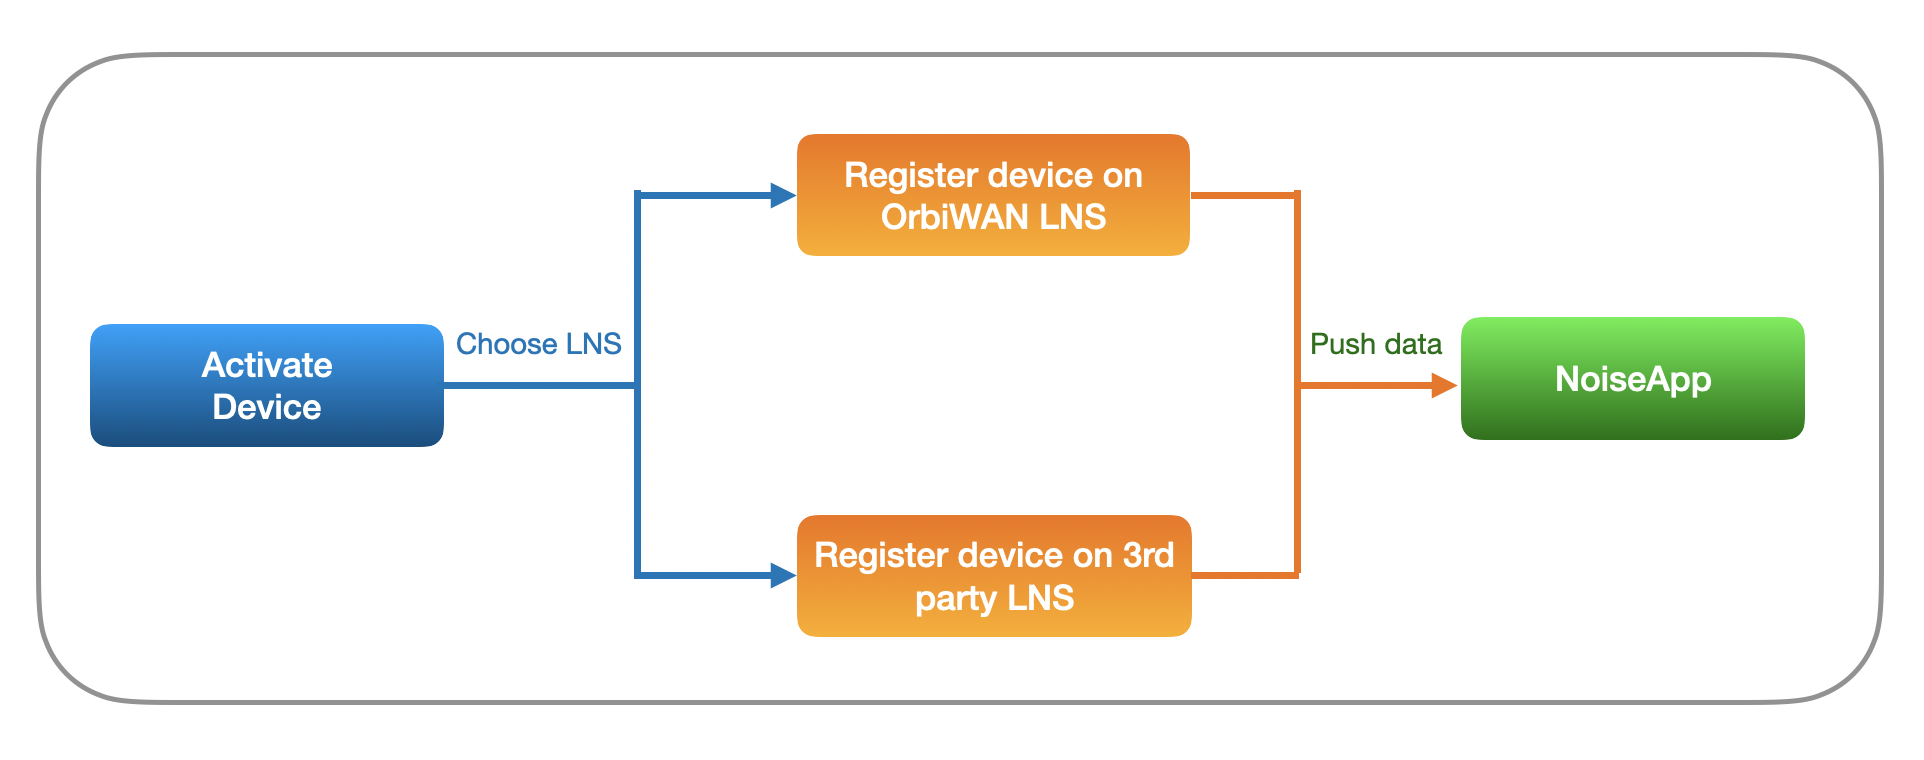
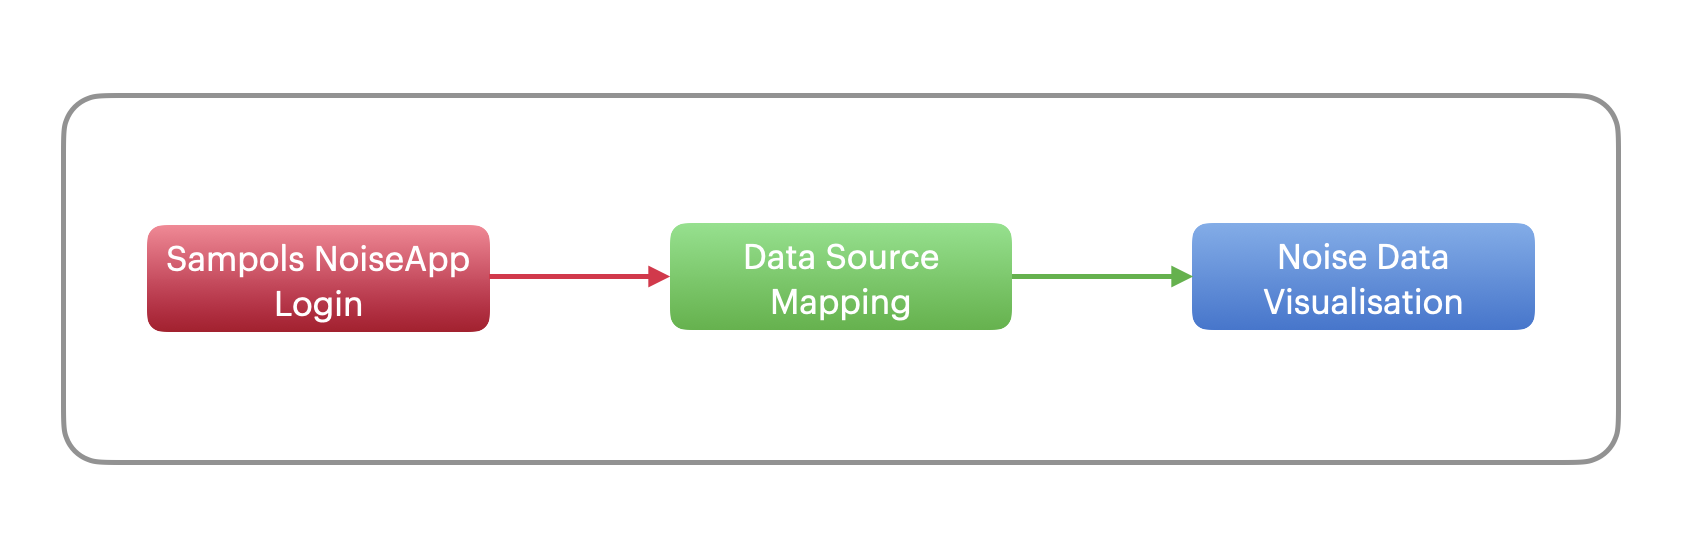
The flow chart above shows the steps in visual format. They are as follows
- Power up and Activate Sampols’ device.
- Register device on LNS (OrbiWAN LNS or third party LNS)
- Push data to the Noise App and view it on NoiseApp
Power up and install your Sampols’ device
Once the Sampols’ Noise sensor has been shipped to you, it might not be operational straight out of the box. In order for the device to starting transmitting data it needs to be powered up. For more information on setting up your device to transmit data head to the installation and maintanance section or click on the link below.
Register device on LNS (OrbiWAN)
After powering up the device the next step is to register the devices on an LNS. To register the Sampols’ device on the OrbiWAN LNS please follow the steps given in link below:
Register device on LNS (3rd Party)
Once the deivce is transmitting, it needs to be registered in the LNS. To register the Sampols’ device in the LNS please follow the steps given link below:
NoiseApp Summary
After device is registered on LoRa LNS , and Noise App is also configured on LNS - the following steps will help you get started with Noise data analysis and visualization Within Sampols NoiseApp.
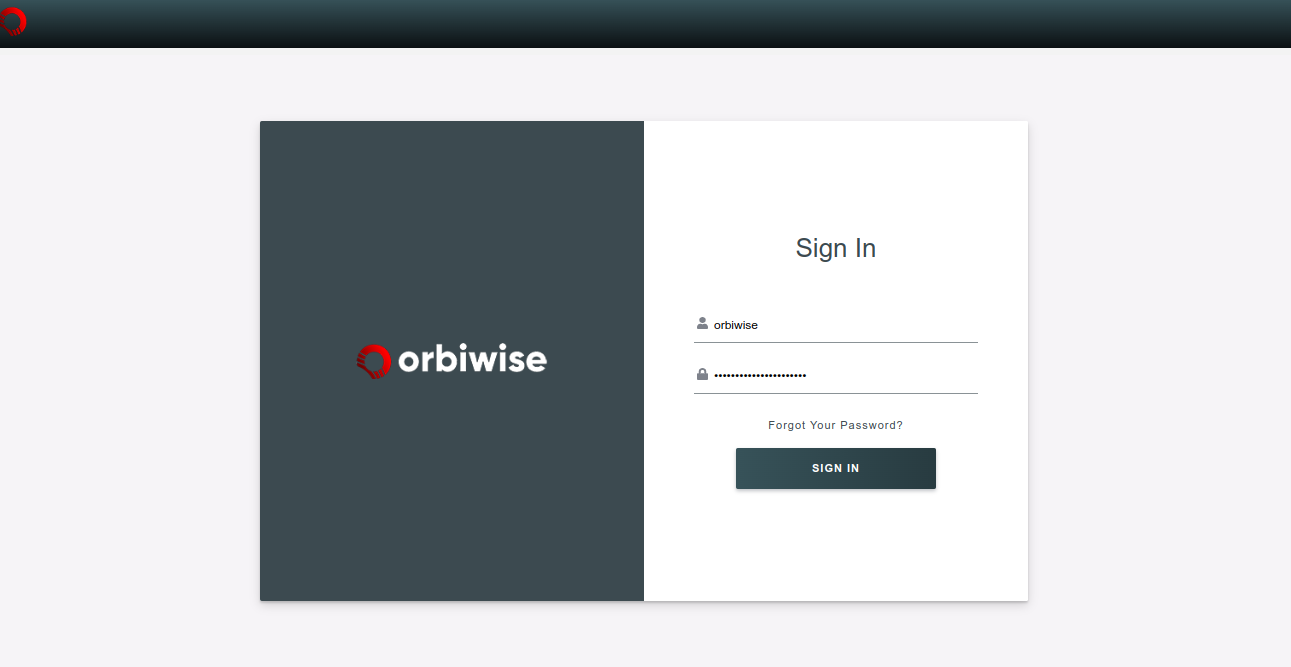
Login to Sampols NoiseApp
After adding the Device to the LNS, we need to setup the Sampols NoiseApp to analyse the Noise data. To Setup, login to the Sampols NoiseApp.
The Login page looks likes as shown in the image below:
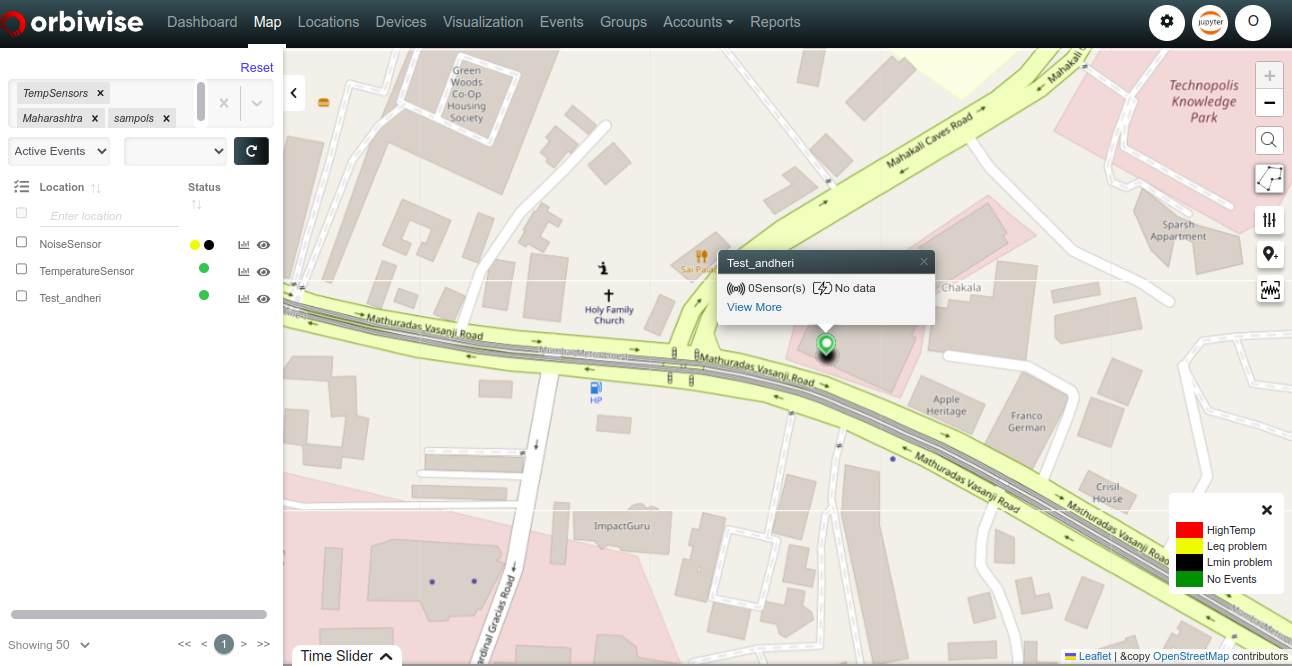
Once you Sign in, you will be redirected to the first page i.e. Map which shows the location of the devices, as shown in the image below:
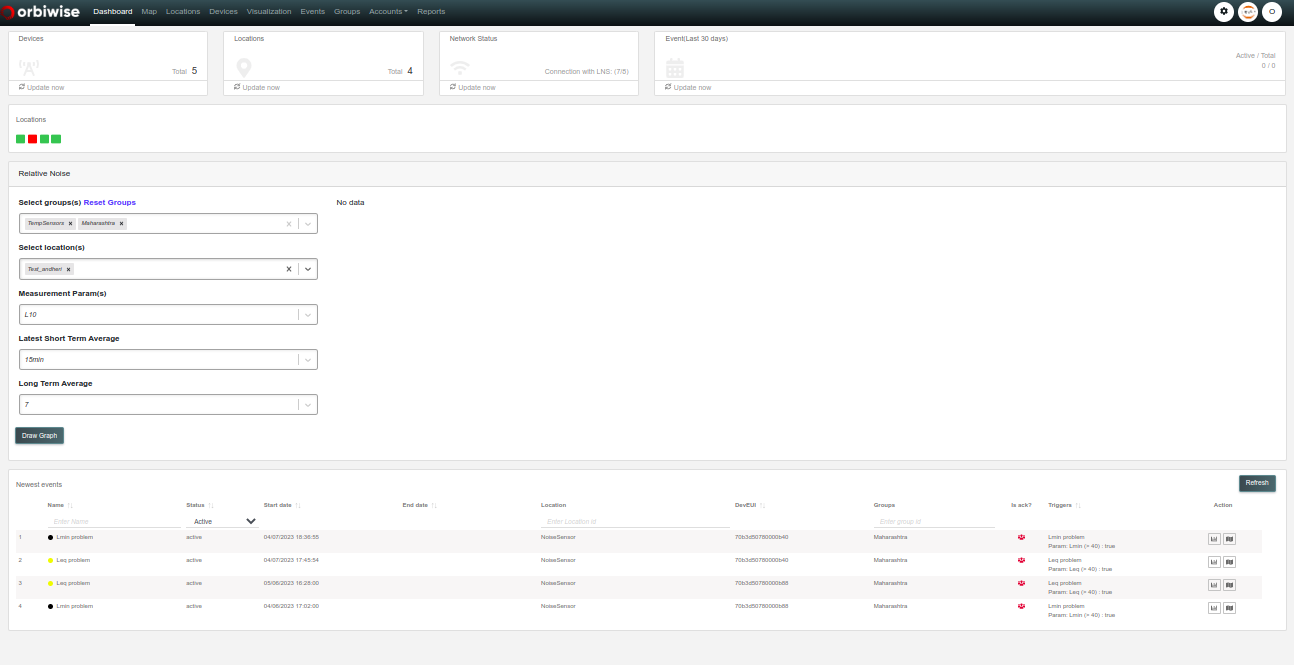
Dashboard
Dashboard gives you a high level overview of your assets. You can see the counts of devices, locations and events. The Dashboard also gives the Location Status and Network Status. A relative noise chart gives you an idea of the current noise levels. Most recent events captured can be seen in the Newest events table.
Map
Map menu shows a customized map where the markers show sensors deployed on the city of choice.
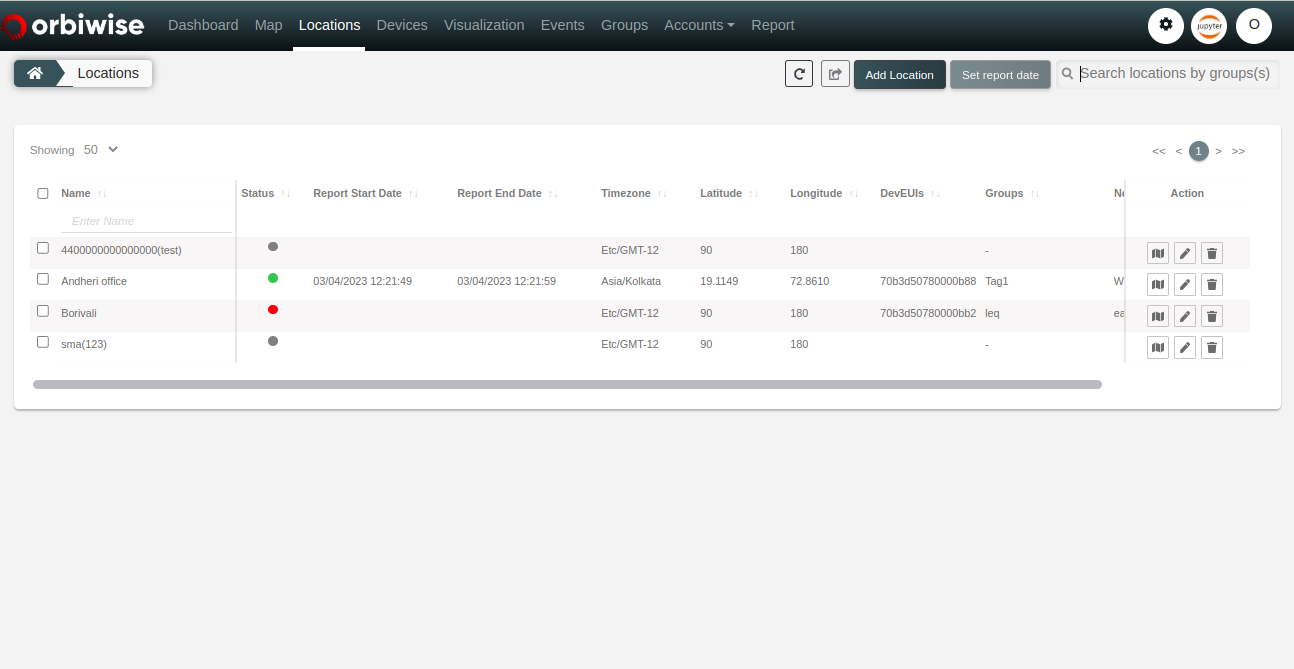
Locations
Allows users to manage locations and generate and export statistics for selected locations.
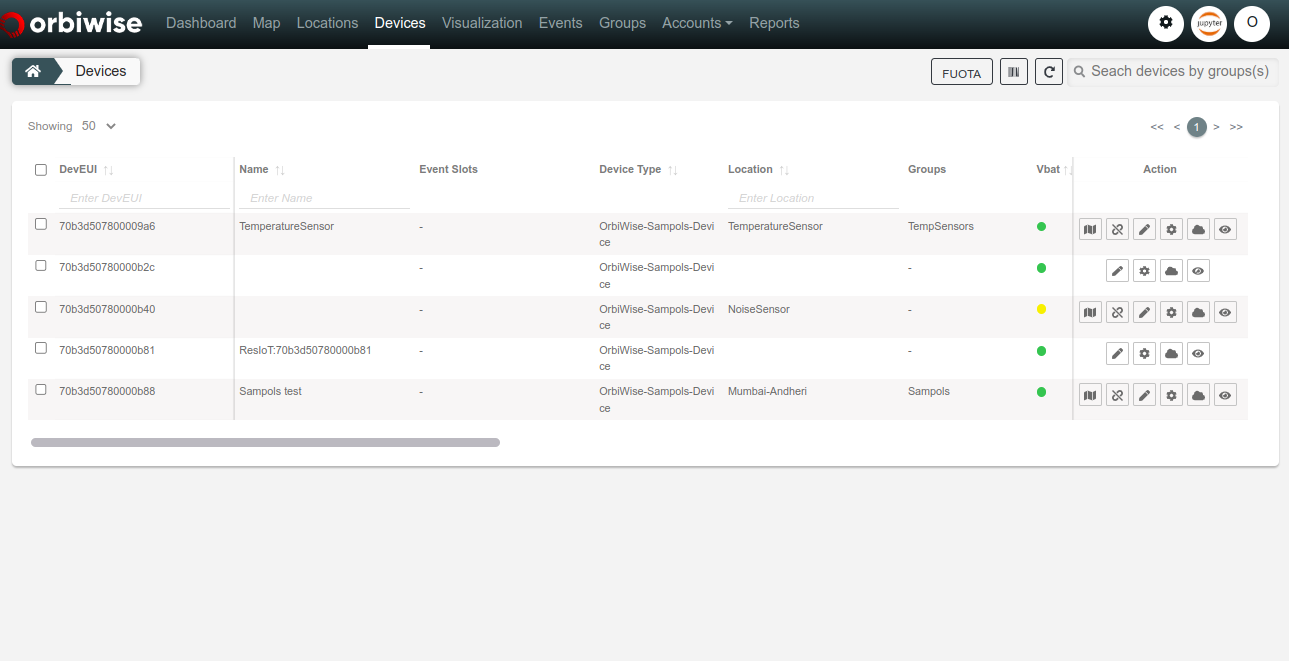
Devices
The devices page allows users to view all sensors along with most recent noise status. The following figure is showing the device page:
Data Source (Application integration with Sampols)
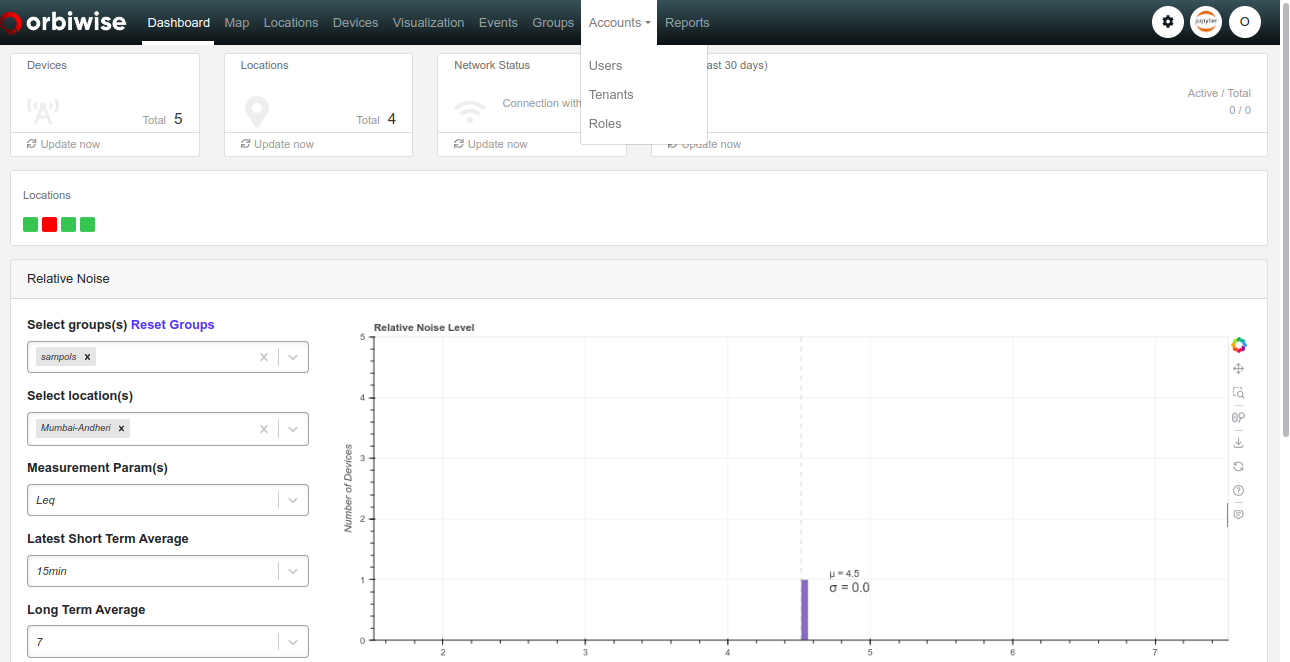
To Add the Data Source the admin has to add a Tenant.
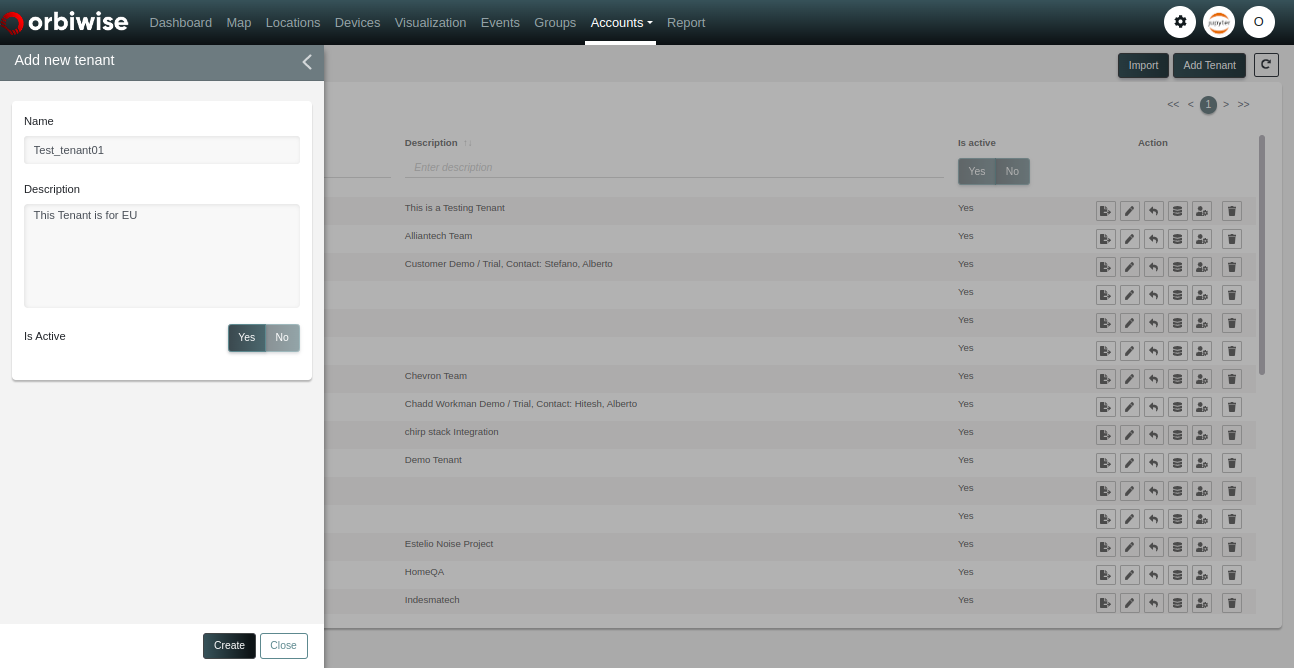
The Tenant Admin will have the rights to Add Tenant. To Add Tenant Navigate to Accounts –> Tenant –> Add Tenant as shown in the image below:
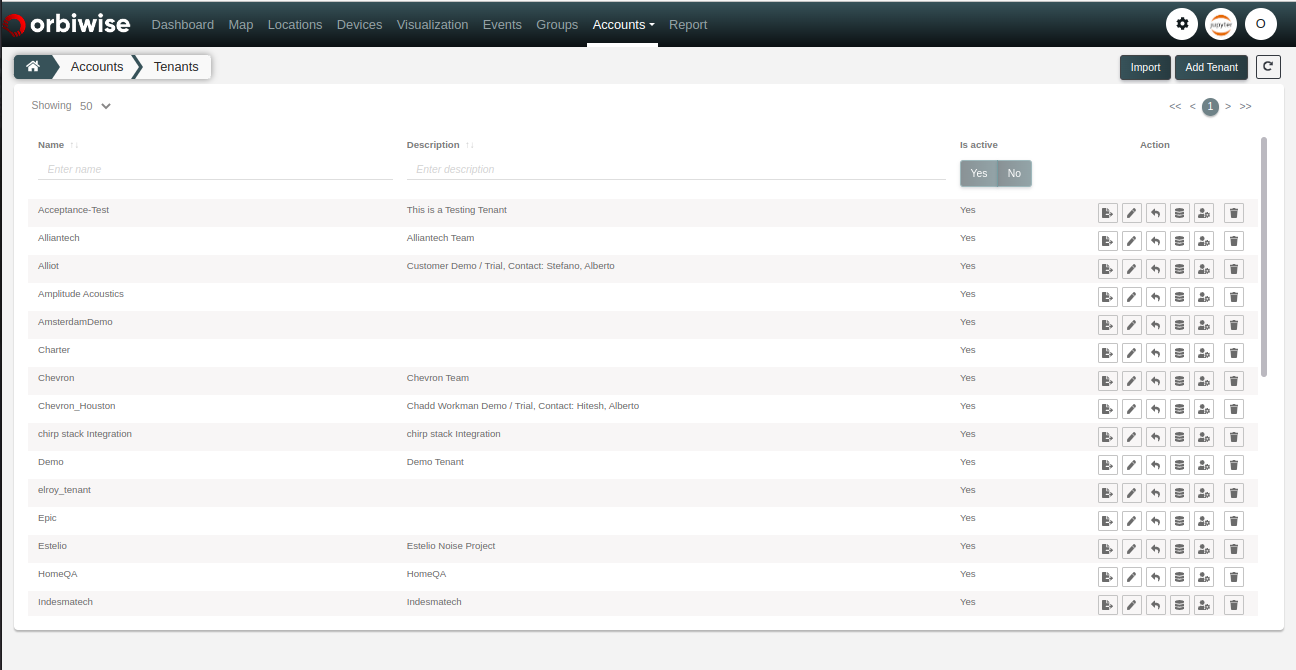
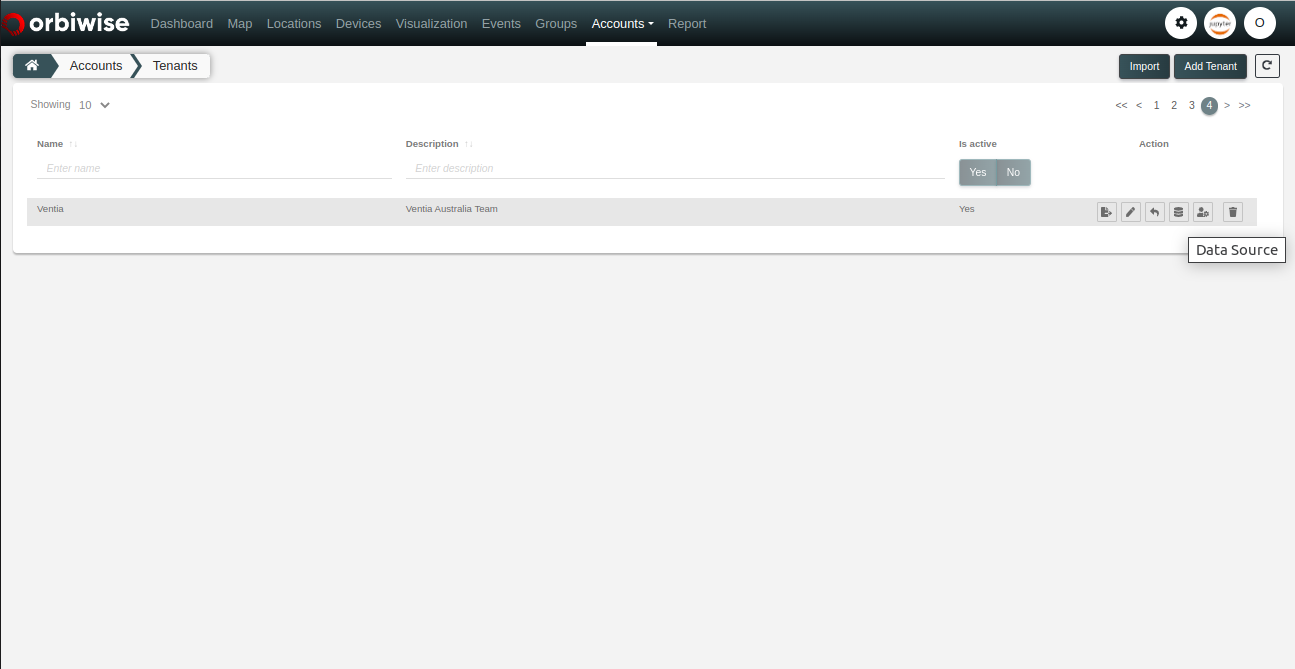
Once the tenant is added, the admin will have to configure the Data Source. The Data Source will be used establish a connection between the LNS and Sampols NoiseApp. To configure the Data Source select the Tenant, Click on Data Source as shown in the image below:
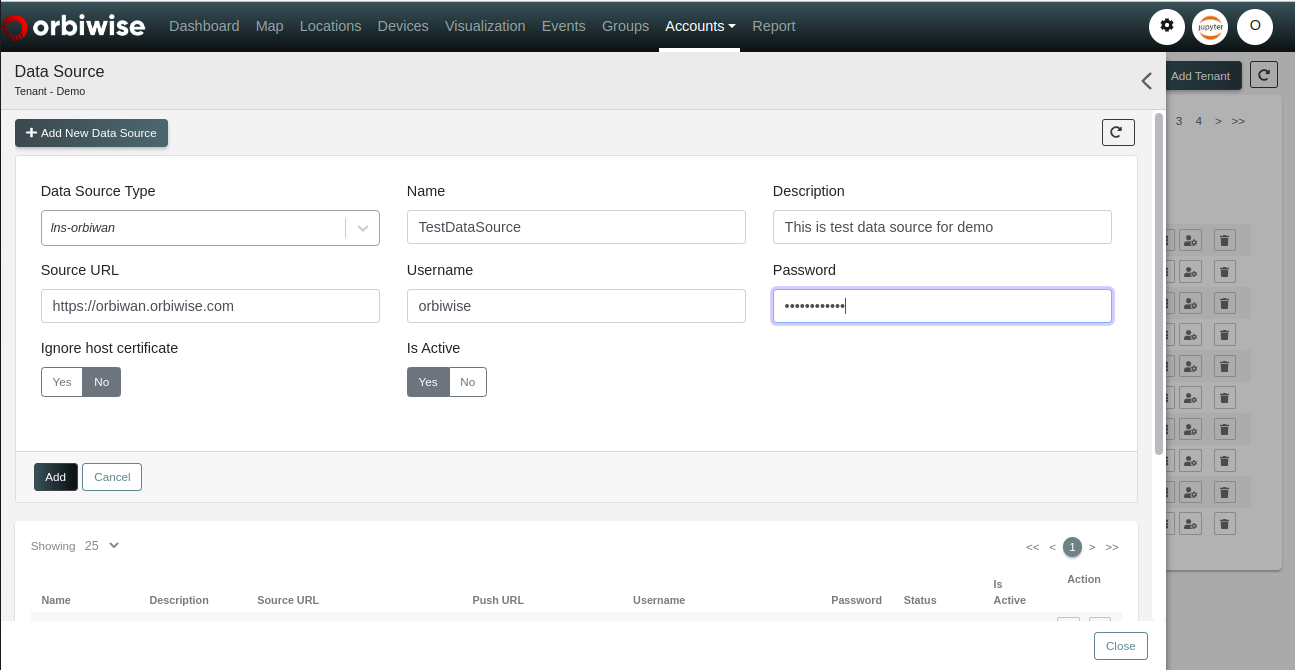
Enter the required details in the fields and click on Add button as shown iin the image below:
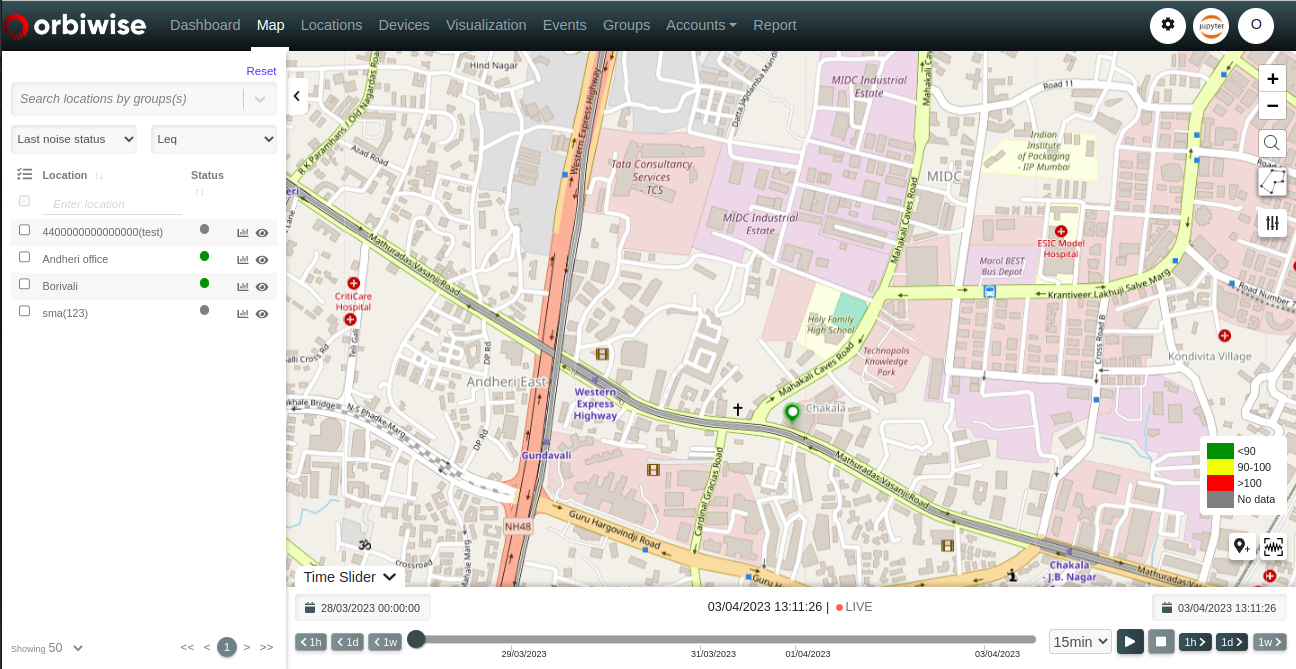
Once, the Data Source is added, the Device registered in the LNS will show in the Sampols NoiseApp after the first Payloads in the Map as shown in the image below:
Note: The Sampols in SAAS Instance is configured by the Orbiwise Team.
Visualization
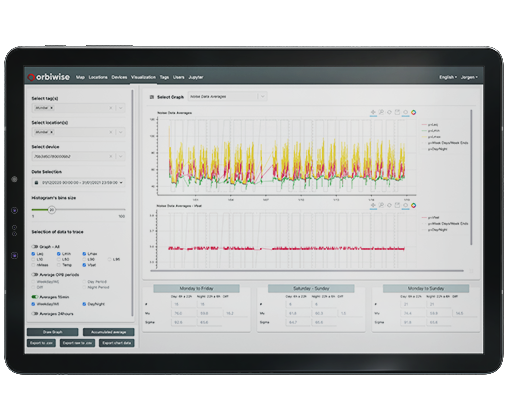
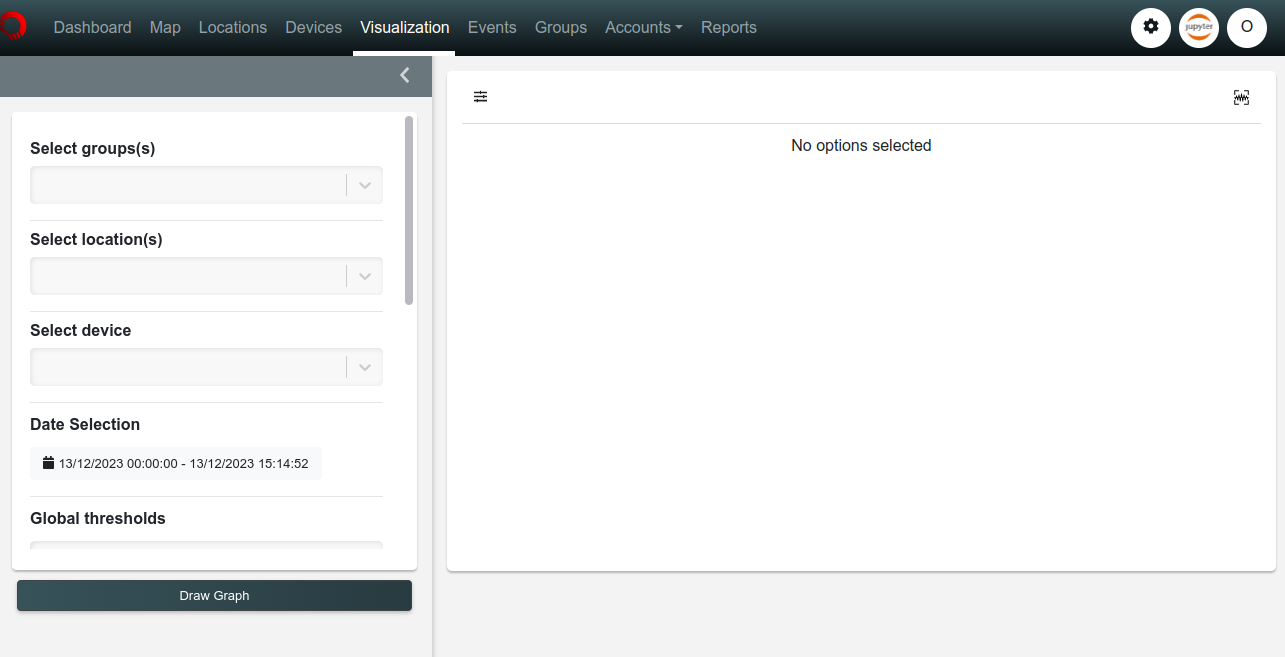
The Visualization page shows the graphical representation of the data received by the Sampols NoiseApp for the analysis.
To view the data select the location in the Select Location(s) section as shown in the below image below:
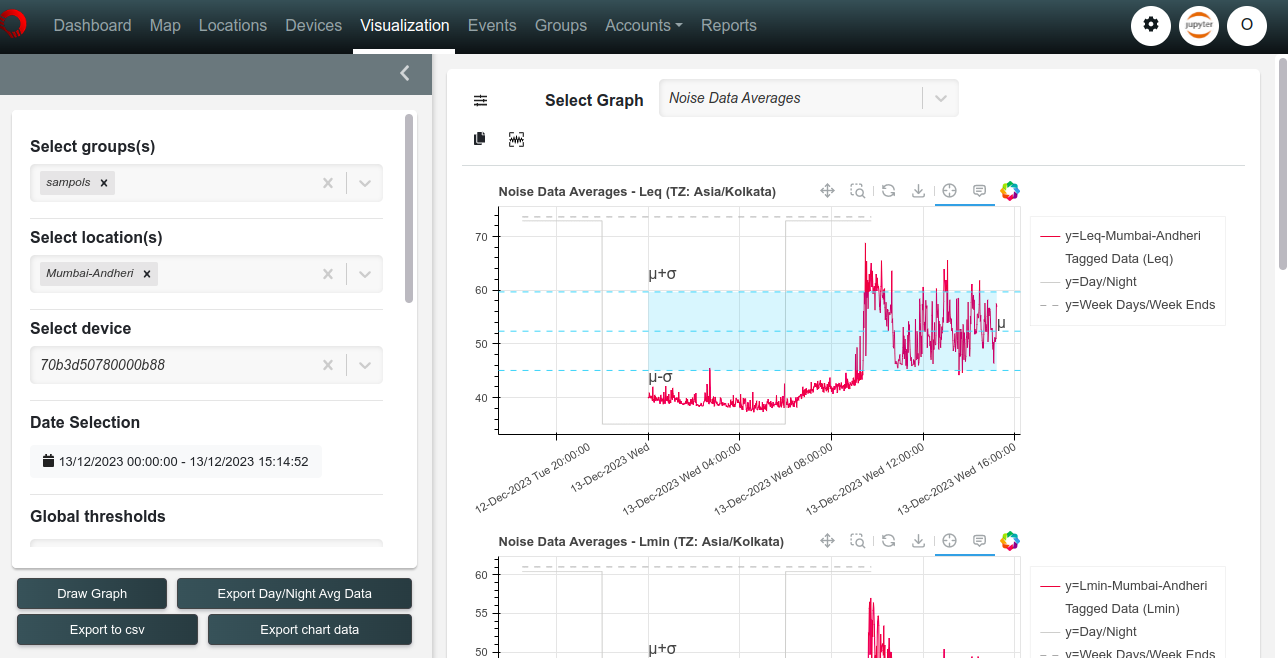
Once, the Location is selected, click on Draw Graph to view the graphical representation of the Noise-Data as shown in the image below:
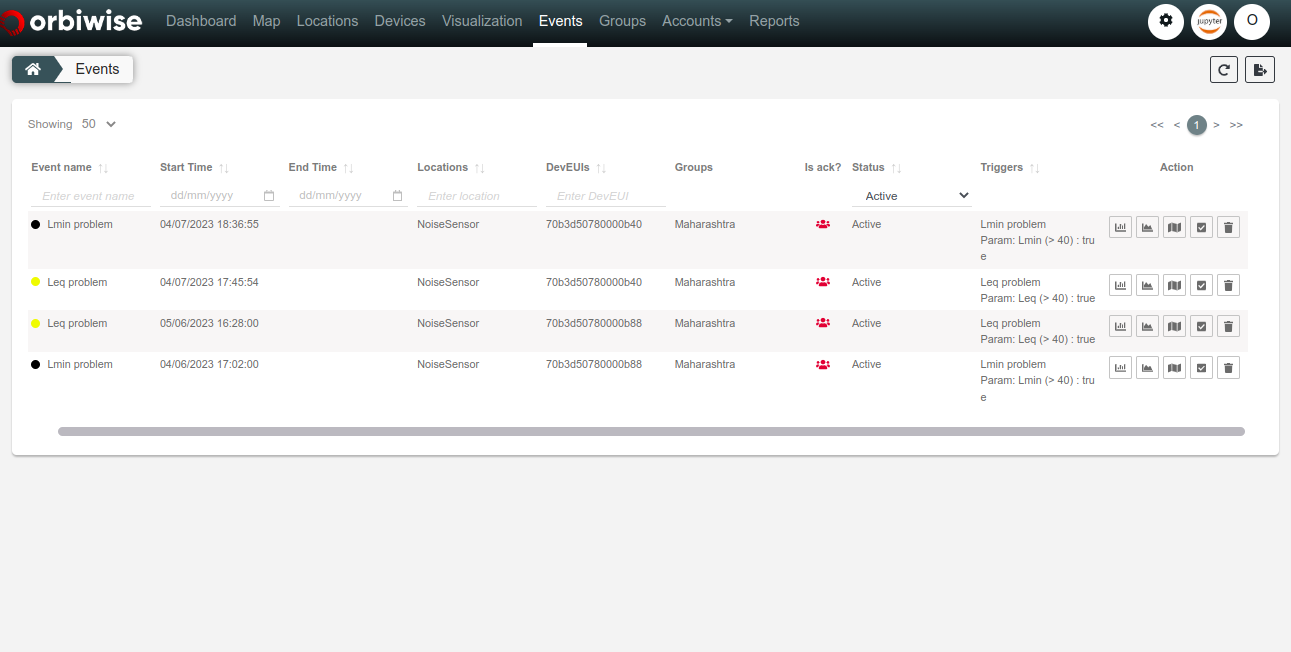
Events
When rules are evaluated and the result is true, then an event is raised. We can specify which event should be raised. Those event types are defined using this page. Please note that in the document, event de ni on and event types are interchangeable.
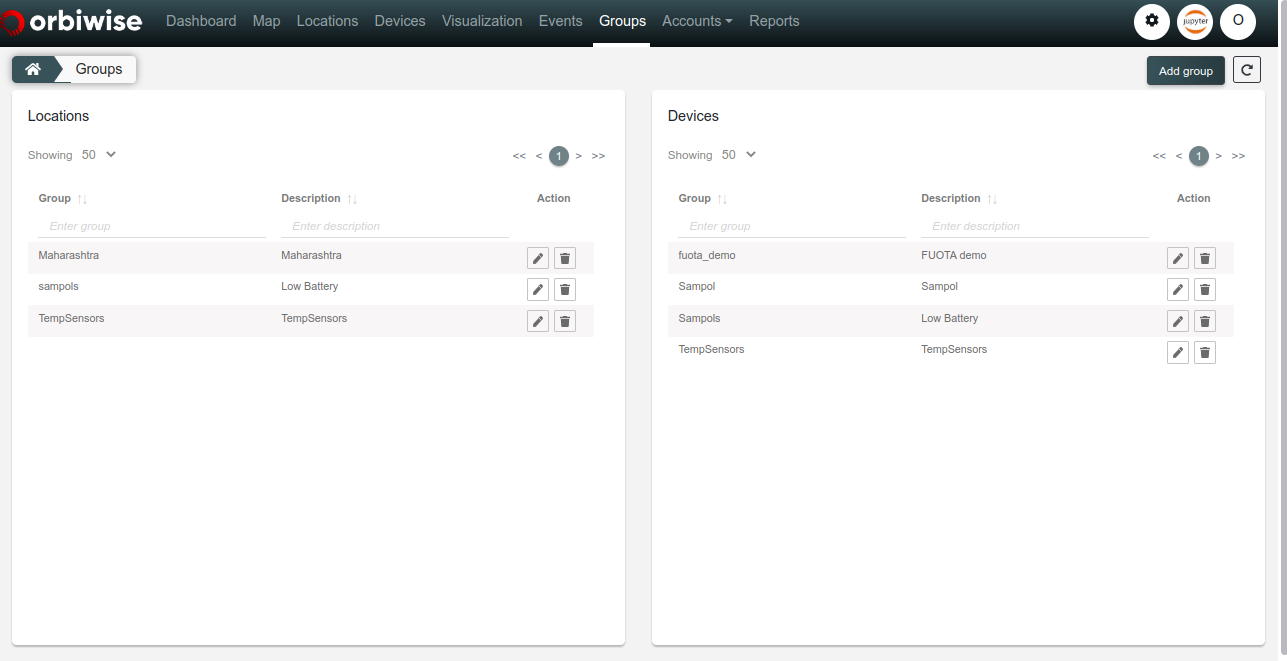
Groups
Groups page allows users to manage groups. Once a group is created, it is available for filtering the locations on Map, Locations, and Visualization page. The figure below shows a listing of the groups. Users can sort and filter the list using group and description. The action column allows users to edit/delete the group.